US Equestrian Industry Statistics 2026: 25 Numbers That Matter
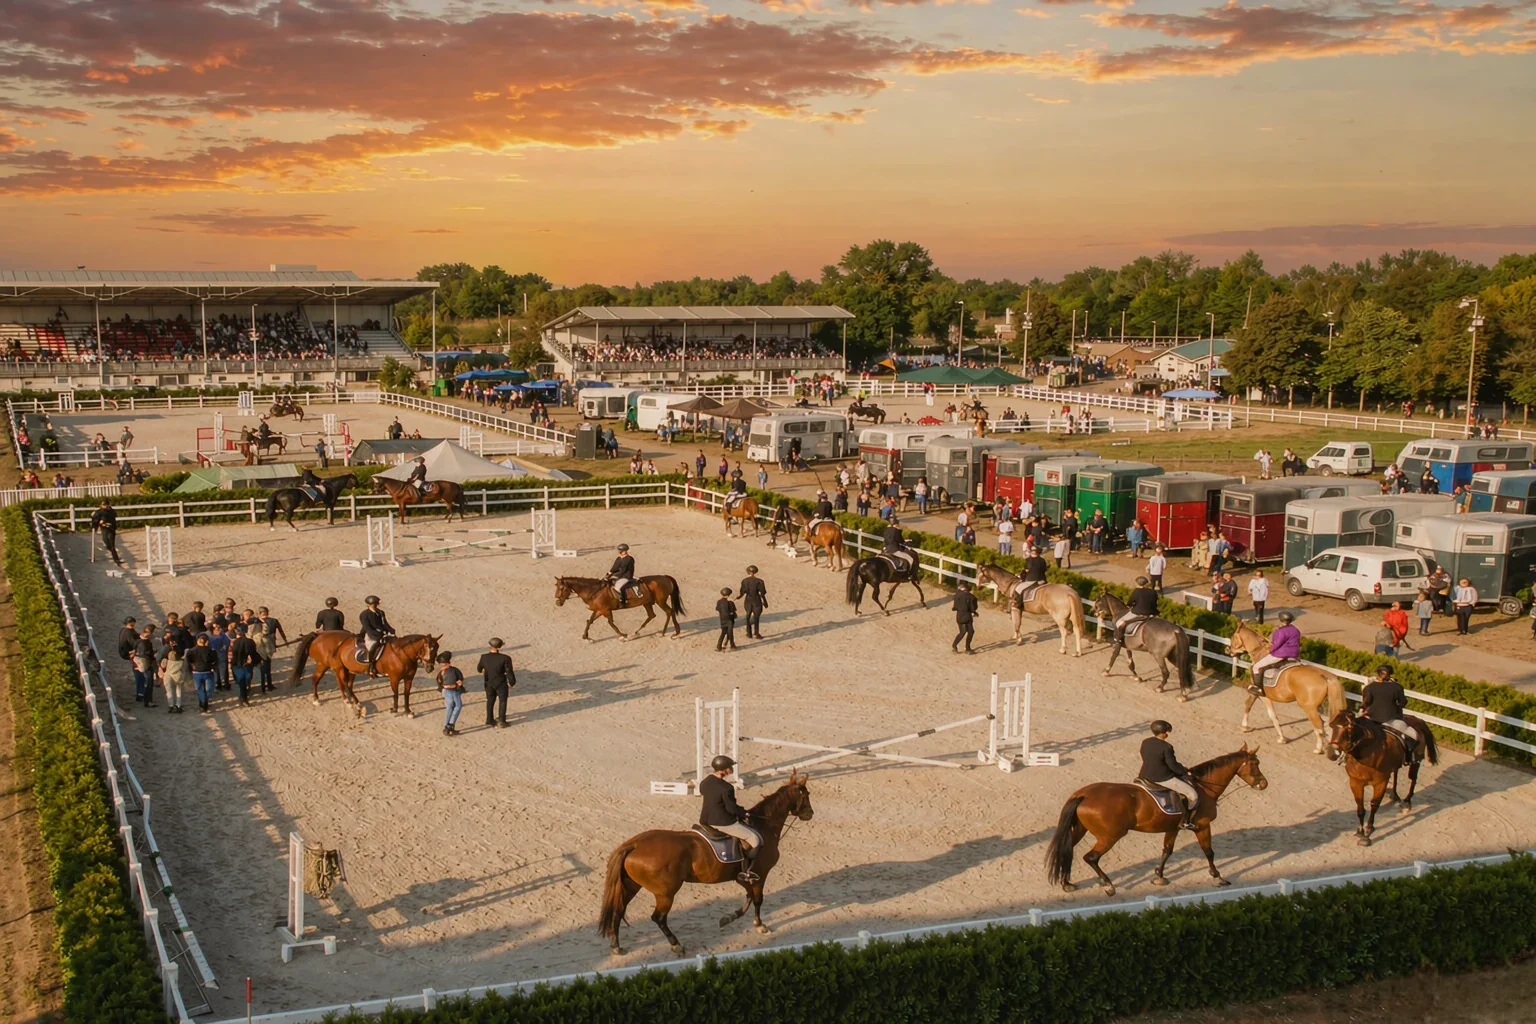
How big the horse world actually is — population, spending, demographics — compiled from the AHC, USDA, AHP and AVMA.
Scale of the Industry
- 6.65 million horses in the US (AHC 2023 study; 7.2M in the 2017 edition)
- 1.6 million horse owners (AHC — the old 4.6M counted everyone involved in the industry, not just owners)
- $177 billion total economic impact per year (AHC 2023 study — $122B is now the wages-and-benefits line, not the total)
- 2.2 million jobs supported (AHC 2023 study; ~1.55M in the six reported sectors)
- 74% of horse use is recreational riding (USDA NAHMS)
Owners Today
- 51% of owners earn $100,000+/yr — up from 42% in 2021 (AHP 2025, n=4,000+)
- 75% kept the same number of horses year-over-year; 15% fewer, 10% more
- Top 3 concerns: cost of horsekeeping, land use, vet access
- 67% have their vet administer vaccines; 43% would pay up to $50 for telemedicine
Retail Market
- Global equestrian products market: $6.8B in 2025 → $11.4B by 2034 (5.9% CAGR, Dataintelo)
- North America holds 34.2% ($2.33B) of global revenue
- US e-commerce share of equestrian sales: 38% vs 29% globally
Veterinary Landscape
- 48% of the equine vet workforce is over 50 (AVMA/AAEP 2024)
- 64% of responding equine practices are solo practitioners
- Equine practices earn 84% of revenue from services — the highest of any vet type
International Benchmarks
- UK: 3.2M regular riders; £8.3B sector contribution (BETA)
- Germany: 1.2M+ active riders (FN)
- Australia: ~850,000 horses (Dataintelo)
Full sourcing and methodology on our About page.
How to Read These Numbers
Industry statistics matter to horse owners for one practical reason: they show where the money and the participants actually are, which predicts what services cost, what is scarce, and what is growing. The figures below are the 2026 planning set — US-based, compiled from the American Horse Council economic studies, AHC national demographics, and industry reporting, rounded for planning use.
The Headline Numbers
| Figure | 2026 value | Planning implication |
|---|---|---|
| US horse population | ~6.6–7.0 million | Demand for hay, vet, farrier stays structurally high |
| Direct economic contribution (six sectors) | ~$54.6 billion/yr — $177B total impact (AHC 2023) | The industry is bigger than most state agricultural sectors |
| Total jobs supported | ~1.55 million in reported sectors; 2.2 million with multiplier effects | Equine careers exist beyond showing |
| Horse owners (people) | ~1.6 million (AHC) | Most owners are recreational, not professional |
| Median owner household income | $60,000–$100,000 | The industry is middle-class, not just wealthy |
| Horses in recreational use | ~55–60% of population | The volume market is trail and pleasure, not show |
Where the Horses Are (and What That Costs)
Regional density tracks the economics in our cost guides: Texas, California, Florida lead in absolute numbers; Kentucky, Wyoming, Montana lead per capita. The density map predicts prices — a dense metro horse population means expensive board and abundant professionals; a sparse rural one means cheap hay and scarce vets. The farriery and vet-access sections of our cost articles are effectively applications of this table.
The Structural Trends Worth Knowing
- Average first horse is older and the owner is older. Adult amateur entry dominates new participation — the “start riding as an adult” path is the industry’s main growth channel.
- Lesson and lease-first behavior is rising. Fewer impulse purchases, more leases; this is stabilizing the school-horse market and depressing the cheap-horse market.
- Hay volatility is the industry’s stress line. Drought years push feed costs 20–40%, which shows up as board increases and horses sold — the reason our hay-budget guide emphasizes buying seasons, not bags.
- Geriatric horses are the fastest-growing segment. Better care means more horses past 20, which is why senior-care costs deserve their own line in every budget.
- Therapeutic and recreational riding programs are among the sector’s steadier employers and a realistic second-career path for horsepeople.
What This Means for an Individual Owner
- You are the median, not the exception. The industry’s center of gravity is a middle-income household with one or two recreational horses — the budgets in our cost guides describe the majority, not a niche.
- Professionals are scarce where horse density is low. In sparse regions, booking farriers and vets a cycle ahead is standard practice, not rudeness.
- The used-horse market is liquid at the middle. Sane, sound, trained horses in the $3,000–$8,000 band trade continuously; the extremes are slower.
- Cost pressure flows from feed first. When hay spikes, board rises 3–9 months later — watching regional hay prices is a legitimate forecasting tool for your boarding contract renewal.
One method note: equine economic data updates on multi-year cycles and estimates vary by source. Treat any single figure — including these — as a planning magnitude, and check the American Horse Council’s current study before citing numbers professionally.
Where the numbers come from
- The Horse Owner's Veterinary Handbook — The reference much of the published health data traces back toCheck Price
- Stable management manual — The classic text behind barn economicsCheck Price
- Equine business planner — For anyone turning these statistics into a business planCheck Price
Guides
Gear & Reviews
Popular Reads